
MedTech Full Year 2022 Results and Preliminary Q1 2023 Analysis
The State of MedTech: Overall Revenue Up but Profitability Negatively Impacted
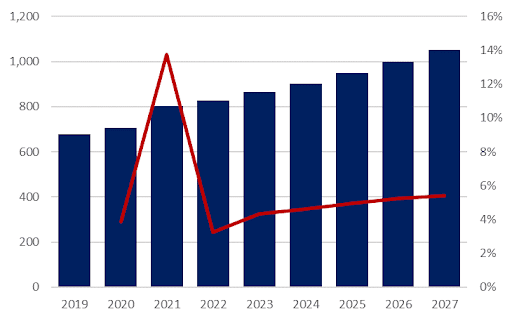
This insight provides full-year 2022 results and preliminary Q1 2023 analysis. After jumping by more than 14% in 2021, the medtech industry experienced a more modest global revenue increase of 3% in 2022—Vamstar is currently forecasting market growth of 4.3% for 2023 with compound annual growth of 5.6% for the years 2019 through 2027.
MedTech Revenue – World – $Billions
Preliminary Margin Analysis Signals Headwinds
Despite overall revenues showing continued growth in Q1 2023, preliminary KPI analysis of gross, operating, and net margins depict a market with increasing business costs.
MedTech KPIs – Margin Analysis Including Preliminary 2023 Results
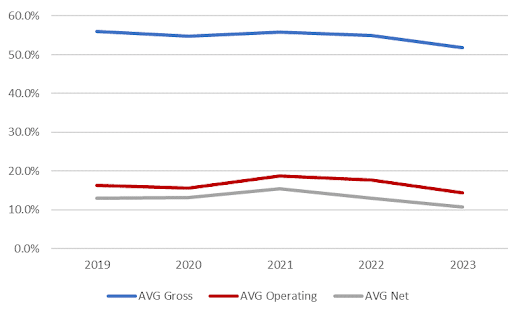
These margin estimates include an analysis of leading suppliers, accounting for 50% of overall global medtech revenue. These companies also represent most of the medtech product categories. So, what is happening to cause this negative trend? There have been high single-digit and even double-digit declines in COVID-19 testing revenue compared to last year for diagnostic lab companies. This is the single biggest factor impacting revenue, followed by lower consumer demand in Europe due to the Russia-Ukraine war and negative impacts from foreign exchange rates. There are several bright spots however, including:
- Continuous glucose monitoring for diabetes care.
- Structural heart, including TAVR and mitral valve solutions. Improvements in supply chain fulfillment have bolstered CT, MRI, and molecular imaging performance.
- Ultrasound continues to see strong uptake as it is increasingly used for cardiovascular and women’s health applications.
- Robotics, particularly Intuitive Surgical, saw procedures grow 26% globally compared to Q1 2022, despite continued disruptions from COVID-19 in China that negatively impacted January volumes.
- Electrophysiology products are used in interventional solutions from Johnson & Johnson, along with contact lenses, surgical wound closure, and orthopedics from the company.
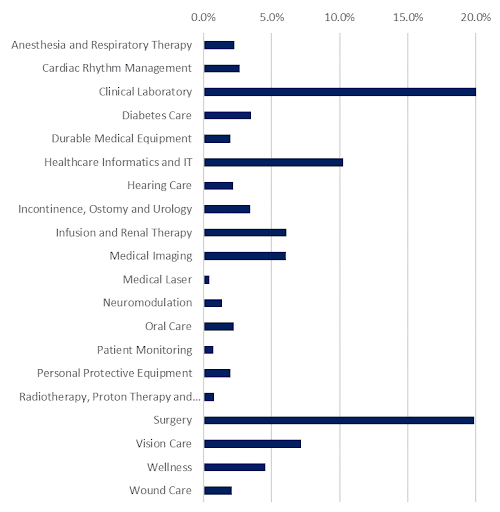
Vamstar notes that this first-quarter analysis is preliminary and is subject to change when the final results are available. Vamstar analyzes the medtech industry every quarter across twenty categories illustrated in the following chart.
MedTech Revenue – Market Share by Product Category – World 2022
Vamstar’s proprietary, AI-based platform captures data for more than 100 countries with lot-level pricing and product data from €1.6Tn of spend. Our regularly updated market share analysis, existing tender market research, and clinical evidence research provide a rich body of technology, tools, information, and insight that can be particularly useful when navigating an economic environment negatively impacting profitability. For timely, data-driven market research on any of our medtech coverage areas, we suggest MedTech Scout. These reports provide a two-week turnaround on any product type in any country in Europe, and it is based on ten years of tender award data. Some of the key benefits of these reports include:
- Quickly visualize the market size and share, identify the largest buyers, identify the top competitors, identify buyer-specific sales cycles, develop go-to-market strategy and increase presence, and optimize sales resources.
- Market Sizing—Spend analysis provided by country and by specific buyers.
- Competitive Landscape—Detailed analysis of which suppliers are winning deals and to whom they sell.
- Market Share—Understand which hospitals are the largest consumers and rank suppliers by their revenue.
- Distributor Networks—Visualize the distributor network at a country level and see who sells the most.
- Trend Analysis—Ten years of tender award analysis available, current open opportunities presented.
- Clinical Evidence and Marketing—Rank suppliers in terms of their clinical papers’ strength and improve marketing based on real-world evidence.
If you’re looking for more information, don’t hesitate. Get in touch with shane.walker@vamstar.io today! He’ll be happy to answer any questions you may have about our products or services.
MedTech Market | Revenue | Analysis | Suppliers | Buyers | Margin | Profit | Growth | Clinical | Medical Equipment | Tender | Artificial Intelligence | Data | Product | Pricing